 How is the state of your portfolio? There are four detection methods that with a bit of effort or investment, you can figure it out.
And you have the temerity, since it’s your money, to desire to know what is actually in your portfolio? Okay then – you have four ways you can proceed.
You likely want to use all four. You can:
- Examine a subset of loans to see if they were underwritten according to real guidelines that you would accept.
- Analyze the portfolio for internal consistency.
- Evaluate the underlying collateral for value.
- Stress test the portfolio yourself since a little stress now (on the portfolio) is much better than a lot of stress later (on you).
You do realize that there are standard ways to do each of these, right? You don’t have to rely on the blandishments of the issuers of these portfolios of loans when you can make a modest effort or investment to figure this out for yourself.
Excel file, containing a lot of interesting information about each loan in the deal. You can get one of these. The fascinating variables are used to determine whether to make a loan and at which interest rate.
- The loan amount
- The interest rate
- The loan type
- The borrower’s credit score
- The loan-to-value ratio
- Debt-to-income ratio
- Owner-occupancy
- More variables describing the borrower or the loan
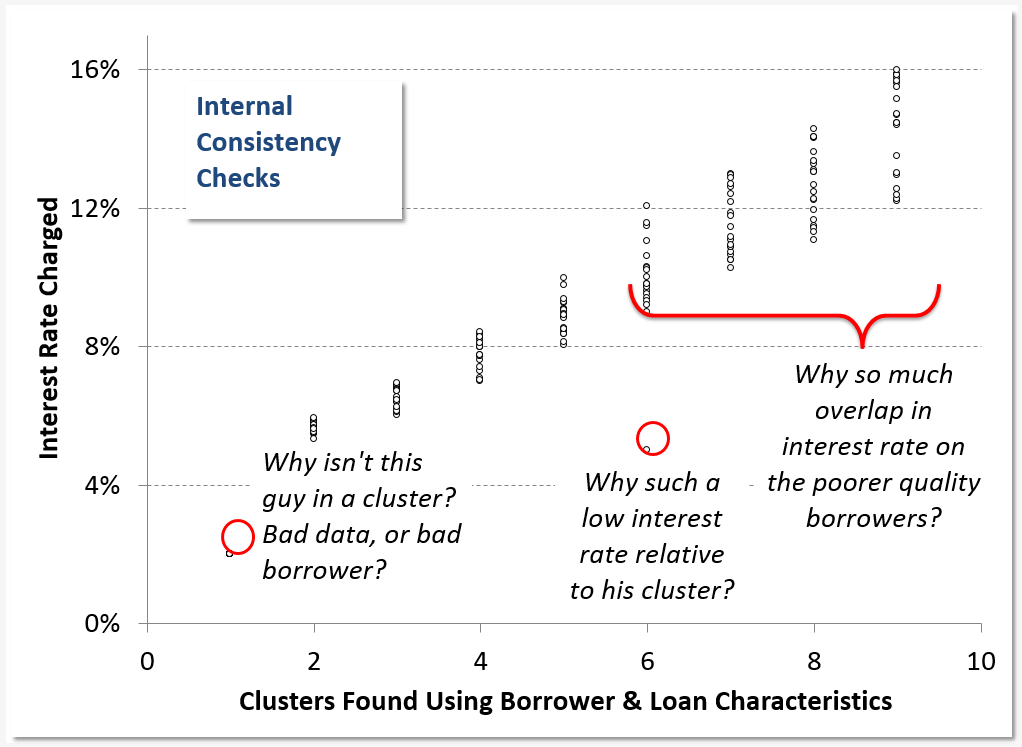 It should be possible to use just this information to develop a model that describes the relationships between these variables and the note rate. If the originators used the variables on the loan file to describe the likelihood of default, then it’s an easy step to get to the interest rate and vice versa. If I cluster loans based on similarity of characteristics (similar credit score, similar LTV, etc.), then I should also find that there is a similarity of interest rates. These loans, the ones found in a cluster, should have similar risk, so similar pricing.
Some clusters may have more consistency than others but just how consistent is the pricing, and how much separation is there between clusters? You’d like to be comfortable that the differences between borrowers reflect differences in risk, and that homogeneity for borrowers means similar borrowers get similar interest rates. Otherwise what you have is a hodgepodge of rules that are followed when convenient and abandoned when not.
Accuracy, in this case, means close on average not that each appraisal was exactly correct. The appraiser searches lists of recent sales close to the property that’s being appraised, pick 3 or 4 that he deems are comparable to the subject property, adjusts the sales prices for differences in characteristics (e.g. square footage, age, lot size), and then averages these adjusted sales prices. The appraiser uses his judgment to pick the comparables, then uses his judgment to make adjustments to the sales prices. There’s a whole lotta judgment going on. With different comps or different judgments, the appraiser would generate a different appraisal. A different appraiser likely would choose other comps and other judgments. Thus, appraisals have some fuzziness to them. Are they variable (and how much variability do they have), are they biased, both?
You can determine whether the appraisals support the collateral estimates used in the loan-to-value calculations. This is done through use of an automated value model an AVM. AVMs value portfolios of loans an AVM estimates property values as of the
time of the sale. AVMs have two benefits that appraisals don’t.
- First, an individual prediction might be above or below the sales price (within a certain tolerance), but on average the deviation is zero. Appraisals and appraisers are not forced to average to zero whatever the bias of the appraiser is that’s what you get in the appraisal.
- A second benefit is appraisal emulation, meaning that for some AVMs the final prediction for a property averages adjusted sales prices for numerous “comparables,” not just 3 or 4. In this situation, the SAME judgments are applied to adjust the sales prices instead of the judgments varying between appraisers.
Many more comparables are used, and typically these are forced to be the properties that are the most similar to the subject property. You now know whether LTV values are high or low and whether you have sufficient collateral. The next and final step is to use this information more efficiently it’s time to stress your loans.
measures, and collateral evaluation. You have the loan tapes that tell you interesting things about how risky each borrower may be
and the collateral underlying each loan. You now can stress test the portfolio in three ways.
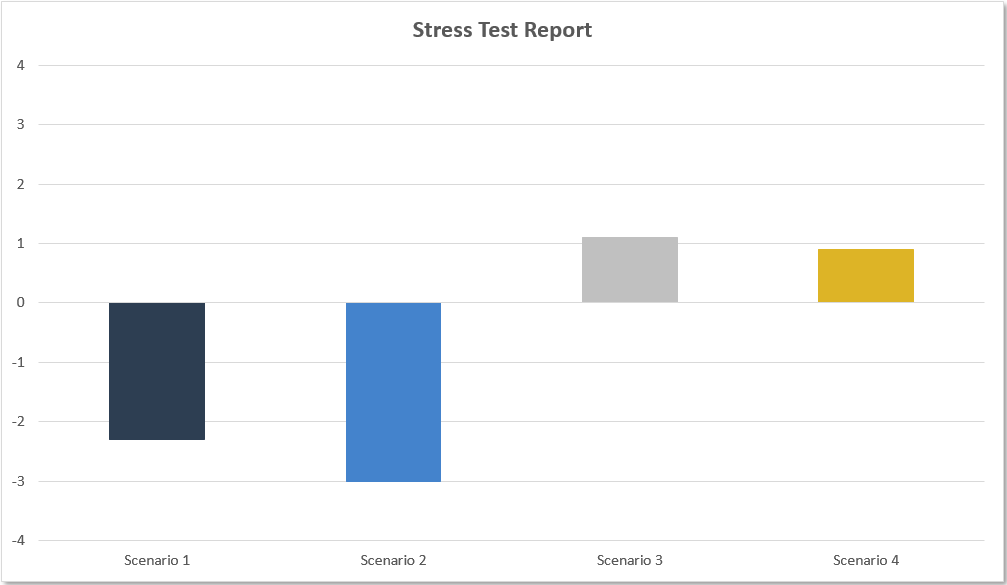
- Method 1: Benchmark
Suppose you accept everything in the loan tapes as fact. You can run your own simulation of how many defaults will occur, prepays, and so on. This doesn’t tell you how much worse the performance might be, but it gives you a benchmark telling you how the portfolio might perform if the economy is stable and there weren’t those pesky problems . . . - Method 2: Change Due To “Concerns”
You have concerns because of problems you found in the re-underwriting, in the valuation of collateral, and in terms of internal consistency within the pool. Play those out in your stress test let the new roll-forward or simulation you run include new likelihoods of default, prepay, and recovery on collateral. - Method 3: Change Due To Economic Change
You already have changes you introduced due to “concerns.” What happens if the unemployment rate changes, or interest rates, or similar macroeconomic indicators? There are forecasts available on these variables available from different government agencies at both the Federal and state level you can find high, average, and low forecasts to apply, or you can go hog wild and implement your own prognostications.
 Stress testing also allows you to consider factors that may not be considered when you look at the portfolio one factor at a time. Perhaps there is an interaction between variables in the portfolio, so that if one variable changes (like debt-to-income ratio), others change too (like available reserves).
What’s next? Tune in next week. Can’t wait? Download the entire white paper here or call us at 210.641.2817.
[button size=’large’ style=’blue’ link=’/sticking-to-the-path/’ linktarget=’_self’ icon=”]Get The White Paper: Why Guidelines Are Important[/button]